Our second grade mathematicians continue to work on telling time to the nearest 5 minute and also identifying a.m. / p.m activities. This week we also are learning about pictographs, bar graphs and interpreting what the data means by making conclusions. We will continue learning about graphs and will even conduct our own surveys to gather data and create graphs.

Tag Archives: graphs
Math Update
Our second grade mathematicians continue to work on telling time to the nearest 5 minute and also identifying a.m. / p.m activities. This week we are learning how to use data from a table and create both picture and bar graphs. Our class has determined they like bar graphs more than picture graphs :).
Graphs, Graphs, Graphs
Math Update!
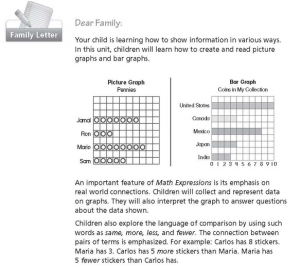
Our little mathematicians have been busily collecting data and creating picture graphs as well as bar graphs. Not only are they creating graphs, but they are “reading” graphs too by answering questions such as:
1. How many more violets do I have in my garden than lilies?
2. How many fewer daisies do I have in my garden than tulips?
3. How many flowers do I have in my garden altogether?
4. If 2 more lilies grow in my garden, how many lilies will I have?
Below is a parent letter that contains more information about our study of graphs.


